data management | Apr 17, 2024
A Comprehensive Guide to Multi-Dimensional Tables

In data analysis and statistics, multi-dimensional tables, also known as contingency tables, multi dimensional tables, or cross-tabulation tables, stand as indispensable tools for organizing, analyzing, and visualizing complex datasets. Despite the variations in terminology, these tables serve the same fundamental purpose and are often used interchangeably in discussions about data analysis.
What is a Multi-Dimensional Table?
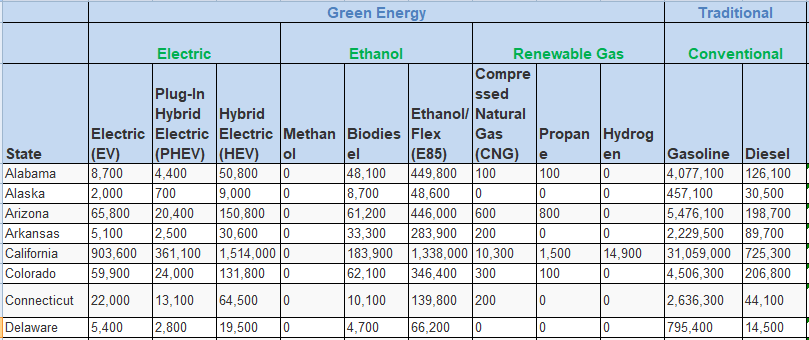
A multi-dimensional table, at its core, is a tabular representation of data that captures relationships between multiple variables simultaneously. It allows for the aggregation and comparison of data across different dimensions, providing a comprehensive view of the dataset's structure and patterns.
How is it Used?
Multi-dimensional tables are extensively used in data analysis, research, and decision-making processes across various industries. They enable analysts to identify trends, correlations, and dependencies within datasets, leading to informed insights and strategic actions.
These tables find applications in diverse fields such as marketing, finance, healthcare, social sciences, and more. For instance, in marketing, they can be used to analyze customer preferences based on demographic factors, purchase behavior, and product categories. In healthcare, it's often used for studying the relationship between treatment outcomes and patient characteristics. In social sciences, it helps to investigate correlations between variables in surveys or experiments.
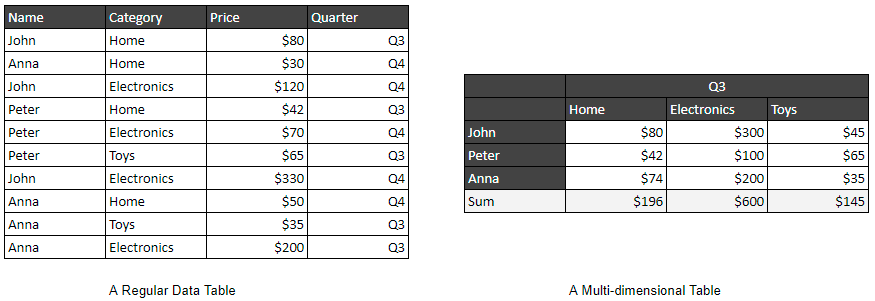
How is it Different from a Regular Table?
Unlike regular tables that display data in a linear format, multi-dimensional tables allow for the representation of data across multiple dimensions simultaneously. This multidimensional aspect enables deeper insights and nuanced analysis of complex datasets.
How is it Different from a Pivot Table?
A multi-dimensional table and a pivot table are both tools used in data analysis, but they differ in their structure and functionality:
Structure:
- Multi-Dimensional Table: A multi-dimensional table organizes data into rows and columns based on multiple categorical variables or dimensions. Each cell in the table represents the intersection of different categories, allowing for analysis across various dimensions simultaneously.
- Pivot Table: A pivot table is a data summarization tool that allows users to reorganize and summarize data from a larger dataset. It typically has rows, columns, and values fields, where users can drag and drop variables to analyze data in different ways.
Functionality:
- Multi-Dimensional Table: Multi-dimensional tables are commonly used for cross-tabulation or contingency analysis, where relationships between categorical variables are explored. They are suitable for analyzing complex relationships and identifying patterns across multiple dimensions.
- Pivot Table: Pivot tables are more focused on summarizing and aggregating data. Users can perform operations like sum, count, average, etc., on numerical data across different categories. Pivot tables are excellent for generating reports and visualizing data trends quickly.
Usage:
- Multi-Dimensional Table: Multi-dimensional tables are prevalent in statistical analysis, market research, and social sciences, where understanding relationships between categorical variables is crucial.
- Pivot Table: Pivot tables are commonly used in data analysis and reporting across various industries. They are especially useful for summarizing large datasets and creating interactive reports.
Read more on Pivot Table Explained
Difficulties in Analyzing or Visualizing Multi-Dimensional Tables:
One of the challenges in working with multi-dimensional tables is the complexity that arises when dealing with large datasets and numerous dimensions. Visualizing such tables in a meaningful and interpretable manner can be daunting, especially when trying to convey intricate relationships and patterns.
Tools for Analyzing and Visualizing Multi-Dimensional Tables:
Several tools excel in analyzing and visualizing multi-dimensional tables, each offering unique advantages:
Ottava
Ottava stands out as a no-code, user-friendly tool specialized in visualizing multi-dimensional tables. Its intuitive interface and powerful features make it ideal for exploring complex datasets and creating insightful visualizations without requiring advanced coding skills.
Read more on Visualizing Multi-Dimensional Data in Action: Vehicle Ownership
Excel (Cross Tabulation in Excel)
Excel offers built-in functionality for creating cross-tabulation tables, making it accessible for users familiar with spreadsheet software. However, its capabilities may be limited for handling large-scale multi-dimensional datasets or advanced visualizations.
Pandas Crosstab
Pandas, a popular data manipulation library in Python, includes a crosstab function for generating cross-tabulation tables. It provides flexibility and customization options for data analysis but requires programming knowledge for implementation.
Benefits of Each Tool
- Ottava simplifies the process of visualizing multi-dimensional tables, allowing users to gain insights quickly and effectively.
- Excel's cross-tabulation feature provides a straightforward approach for basic analysis and visualization tasks.
- Pandas crosstab in Python offers robust capabilities for data manipulation and advanced analysis, suitable for users with programming expertise.
Read more on Unveiling the Power of Data Visualization Software, Tools, and Platforms
Conclusion
Multi-dimensional tables, whether referred to as contingency tables, cross-tabulation tables, or crosstabs, are invaluable assets in the realm of data analysis. Understanding their concepts, applications, and tools for analysis and visualization empowers analysts and decision-makers to unlock actionable insights from complex datasets. With tools like Ottava leading the way in simplifying data exploration and visualization, harnessing the power of multi-dimensional tables becomes more accessible and impactful than ever before.