stories | Jan 17, 2024
Pivot Challenge: Can you analyze this aggregated data?
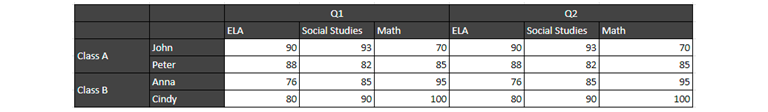
My mom is a teacher; one day, she showed me the class grades and asked me how she could re-arrange them to see how students were doing in each class across Q1 and Q2 and find out which students were falling behind on any specific subject.
“Easy peasy." I was more than confident. Pivot tables and pivot charts are for slice and dice; I immediately thought about using them. I am not an expert, but I've used Excel pivot table at work a few times. I opened up my laptop and input the grade data, starting to insert a pivot chart.
“Hum,” I immediately ran into a warning message saying that data has to be in labeled columns.
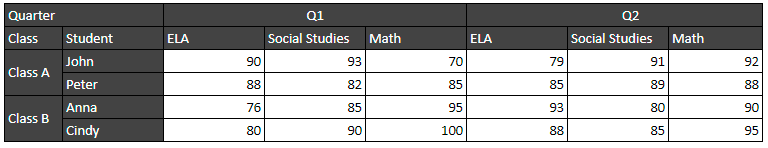
I updated the table so that the columns are labeled.
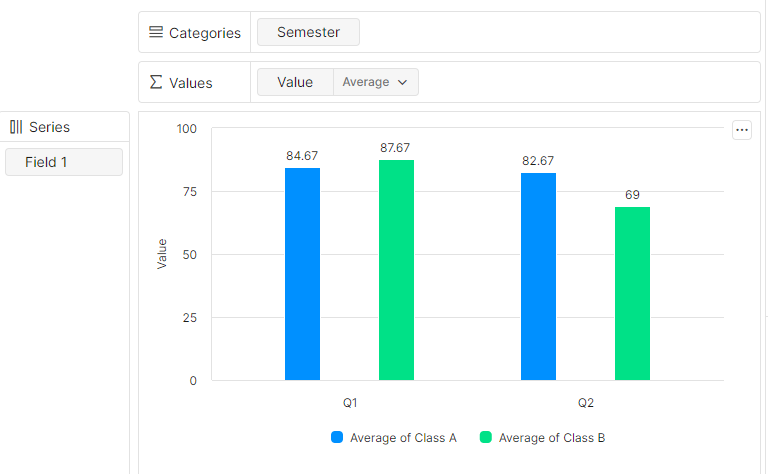
After the change, I was able to select a range and insert a pivot chart, except for the very top quarter row. Nevermind. The resulting chart looks like this:
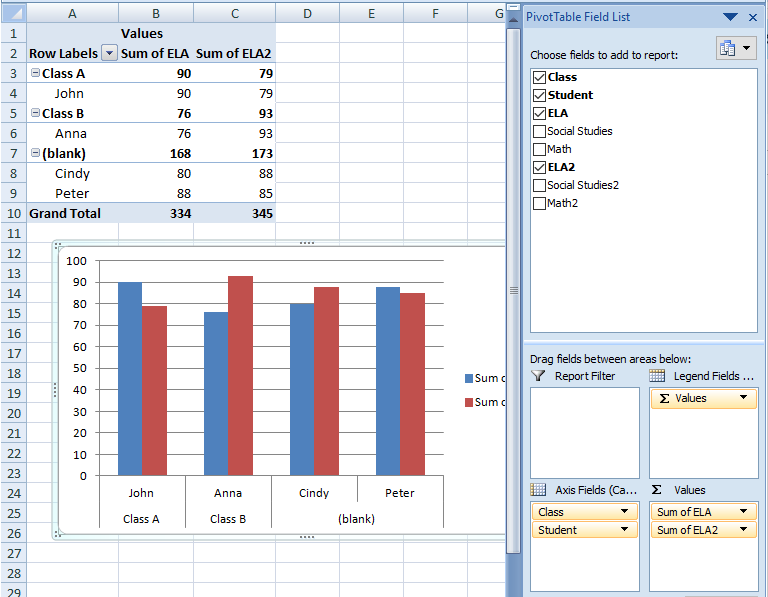
Almost there. But it’s not grouping students in the correct classes: Peter should be in Class A and Cindy should be in Class B.
I switched the rows and columns and tweaked them here and there. I could not get a helpful chart comparing the two classes. Also, I could not include Q1 and Q2 in the charts at all.
I stumbled upon several forums and finally concluded that this grade book is not something I can slice and dice with pivot table in Excel directly. I will first have to convert it into tabular data before I can pivot it.
Tabular data, what exactly is it?
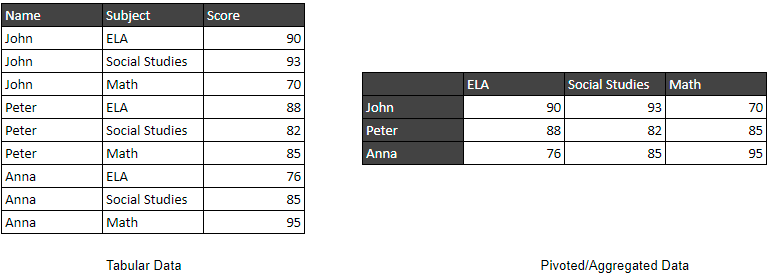
Tabular data (left) has a row header indicating the meaning of each column, followed by rows of data, either text or numbers. It is well-structured and can be easily filtered, sorted and analyzed.
But it is different from the original grade book I have (right) – which is generally grouped; it has one or more row headers, one or more column headers, and many numbers in the main grid.
Read more on Understanding the Power of Pivoting and Un-Pivoting
I've tried to use other popular spreadsheet apps like Tableau, and they all have the same requirement - you have to unpivot or shape your data in tabular format before you can even start to analyze them. In Excel, this unpivot process is normally done with advanced tools like Power Query. Unpivot can also be done using Python or other advanced platforms.
How inconvenient! Wouldn't it be great if we could explore the grade book directly without having to convert it back to the tabular data?
That’s where the Ottava approach comes in to change the game.
Ottava is designed to work with pivoted or aggregated data directly, such as this grade book, sales reports, or an annual budget. Simply input the pivoted/aggregated data as it is, and it will intelligently suggest appropriate pivot charts for you to pick from.
This brings two advantages: first, obviously, skipping the unpivot, or pivoted-to-tabular transformation, saves time and makes the process of analyzing pivoted data easier.
Secondly, the pivoted table preserves more high-level information. If you take a look at the pivoted data below:
You can tell the hierarchy from the table. For example, you can tell there are two classes, A and B, where John and Peter belong to Class A, and Anna and Cindy belong to Class B. Also, you can tell that there are two quarters, and in each quarter, students study three subjects.
With this information, we can assume that the user having this table would want to compare the grades between Class A and Class B; or compare the grades across Q1 and Q2.
If you turn your pivoted data into tabular data, such hierarchy information is no longer there, and all fields are treated equally. A tool that analyzes this tabular data has less information to predict what the user really wants to visualize.
Ottava’s distinctive capability of analyzing pivoted data streamlines the data analysis process, saving valuable time and providing users with a seamless experience. Most importantly, now, my mom can easily visualize and explore her grade book with Ottava all by herself!
If this sounds like something you’ve been waiting for, give it a try and let us know what you think!